

Prepare Analytics-Con-301 Exam Questions [2026] Recently Updated Questions
Give push to your success with Analytics-Con-301 exam questions
NEW QUESTION # 15
A client has a pipeline dashboard that takes a long time to load. The dashboard is connected to only one large data source that is an extract.
It contains two calculated fields:
. TOTAL([Opportunities])
* SUM([Value])
It also contains two filters:
. A Relative Date filter on Created Date, a Date field containing values from 5 years ago until today
. A Multiple Values (Dropdown) filter on Account Name, a String field containing 1,000 distinct values A consultant creates a Performance Recording to troubleshoot the issue, and finds out that the longest-running event is "Executing Query." Which step should the consultant take to resolve this issue?
- A. Replace the TOTAL([Opportunities]) calculation with a Grand Total.
- B. Replace the Relative Date filter with a Multiple Values (Dropdown) filter on YEAR([Created Date]).
- C. Replace the Multiple Values (Dropdown) filter with a Multiple Values (Custom List) filter.
- D. Replace SUM([Value]) with WINDOW_SUM([Value]).
Answer: B
Explanation:
To improve the loading time of the pipeline dashboard, which primarily suffers from long query execution times due to a comprehensive Relative Date filter:
Relative Date Filter Issue: The existing Relative Date filter on "Created Date" covers a broad range (5 years), leading to significant data processing overhead as it includes granular date calculations over a large dataset.
Optimized Approach: By replacing the Relative Date filter with a Multiple Values (Dropdown) filter based on YEAR([Created Date]), the filter granularity is reduced. Filtering by year simplifies the query by limiting the volume of data processed and reducing the complexity of the filter condition.
Implementation Benefit: This approach still provides the flexibility to view data across different years but does so by reducing the load on the database during query execution, which is critical for improving the performance of the dashboard.
References
This recommendation aligns with Tableau performance optimization strategies, specifically regarding the management of date filters to minimize their impact on query load, as discussed in Tableau performance tuning sessions and guides.
NEW QUESTION # 16
A stakeholder has multiple files saved (CSV/Tables) in a single location. A few files from the location are required for analysis. Data transformation (calculations) is required for the files before designing the visuals. The files have the following attributes:
. All files have the same schema.
. Multiple files have something in common among their file names.
. Each file has a unique key column.
Which data transformation strategy should the consultant use to deliver the best optimized result?
- A. Use join option to combine/merge all the files together before doing the data transformation (calculations).
- B. Apply the data transformation (calculations) in each require file and do the wildcard union to combine/merge before designing the visuals.
- C. Use wildcard Union option to combine/merge all the files together before doing the data transformation (calculations).
- D. Apply the data transformation (calculations) in each require file and do the join to combine/merge before designing the visuals.
Answer: C
Explanation:
Moving calculations to the data layer and materializing them in the extract can significantly improve the performance of reports in Tableau. The calculation ZN([Sales])*(1 - ZN([Discount])) is a basic calculation that can be easily computed in advance and stored in the extract, speeding up future queries. This type of calculation is less complex than table calculations or LOD expressions, which are better suited for dynamic analysis and may not benefit as much from materialization12.
References: The answer is based on the best practices for creating efficient calculations in Tableau, as described in Tableau's official documentation, which suggests using basic and aggregate calculations to improve performance1. Additionally, the process of materializing calculations in extracts is detailed in Tableau's resources2.
Given that all files share the same schema and have a common element in their file names, the wildcard union is an optimal approach to combine these files before performing any transformations. This strategy offers the following advantages:
Efficient Data Combination: Wildcard union allows multiple files with a common naming scheme to be combined into a single dataset in Tableau, streamlining the data preparation process.
Uniform Schema Handling: Since all files share the same schema, wildcard union ensures that the combined dataset maintains consistency in data structure, making further data manipulation more straightforward.
Pre-Transformation Combination: Combining the files before applying transformations is generally more efficient as it reduces redundancy in transformation logic across multiple files. This means transformations are written and processed once on the unified dataset, rather than repeatedly for each individual file.
References:
Wildcard Union in Tableau: This feature simplifies the process of combining multiple similar files into a single Tableau data source, ensuring a seamless and efficient approach to data integration and preparation.
NEW QUESTION # 17
A multi-national company wants to have a Tableau dashboard that will provide country-level information for both its forecast summaries and year-on-year metrics. The company wants to toggle between these two views while leaving main key performance indicators (KPIs) visible on the main dashboard.
Which method is the most efficient in achieving the company's requirements?
- A. Create a dashboard with the sheets containing the main KPIs and the forecast summary worksheet.
. Duplicate this dashboard and replace the forecast view worksheet with the year-on-year metrics worksheet.
. Add navigation buttons to both dashboards. - B. Create a parameter that accepts values from a list that contains "Forecast View" and "Year-on-Year View."
. Right-click the parameter and select Add to Sheet for both worksheets.
. Navigate back to the dashboard and to the upper corner of the two worksheets.
. Enable the Use as Filter option. - C. Create a single worksheet with all the measures required for both the forecast summary and the year-on-year views.
. Create a Boolean parameter and a corresponding calculated field with the following calculation: True.
. Add a blank dashboard object and in the Layout tab, check the box for "Control visibility using value" and select the parameter you created. - D. Create a Boolean parameter with the two names of the views as aliases and a corresponding calculated field with the following calculation: True.
. Add the forecast summary sheet to the dashboard and add the year-on-year metrics sheet to the same dashboard as a Floating dashboard object.
Answer: D
Explanation:
. Add the calculated fields as a Detail under the Marks card of the floating view, create a "Change Parameter" action, and set the
"Target Parameter" and "Source Fields" to the parameter and calculated field you created.
. Check the box for "Control visibility using value" in the Layout tab of the floating view and select the parameter you created.
Explanation:
The most efficient method for toggling between two views (forecast summaries and year-on-year metrics) while keeping main KPIs visible involves using a parameter and calculated fields for controlling visibility:
Create a Boolean Parameter: This parameter will have two aliases representing the two views ("Forecast View" and "Year-on-Year View"). This allows the user to select which view they wish to see directly from the dashboard.
Calculated Field: Create a calculated field that always returns True. This field acts as a constant placeholder to enable the visibility control tied to the parameter.
Dashboard Setup: Place both the forecast summary and the year-on-year metrics sheets on the dashboard. Set the year-on-year metrics sheet as a floating object over the forecast summary.
Visibility Control: Use the "Control visibility using value" option in the Layout tab for the floating year-on-year metrics view. Tie this setting to the Boolean parameter so that changing the parameter will show or hide this view without affecting the main KPIs displayed on the dashboard.
Interactivity: Implement a "Change Parameter" dashboard action where selecting different options in the dashboard (e.g., clicking on certain parts) triggers the parameter to change, thus toggling the visible view.
References
This method leverages Tableau's dashboard interactivity features including parameters, calculated fields, and visibility settings, as recommended in Tableau's user guide on dynamic dashboard design.
NEW QUESTION # 18
A client is concerned that a dashboard has experienced degraded performance after they added additional quick filters. The client asks a consultant to improve performance.
Which two actions should the consultant take to fulfill the client's request? Choose two.
- A. Add existing filters to Context.
- B. Use Filter Actions instead of quick filters.
- C. Ensure filters are set to display "Only Relevant Values" instead of "All Values in Database."
- D. Modify filters to include an "Apply" button.
Answer: B,D
Explanation:
Comprehensive and Detailed Explanation From Exact Extract:
Quick filters are one of the most expensive features in Tableau because they require queries to populate value lists and dynamic recalculations when filters change.
According to Tableau performance documentation:
1. Add an "Apply" Button
This prevents Tableau from re-running queries every time the user selects a filter value.
Queries are executed once when the user presses Apply.
This is a documented best practice for filter-heavy dashboards.
2. Replace Quick Filters with Filter Actions
Filter actions are far more efficient because:
* They leverage the existing view context
* They do not require separate filter UI queries
* They avoid the overhead of quick filter value lists
Tableau recommends using filter actions instead of multiple quick filters for better performance.
Why the other options are incorrect:
* B. Add filters to Context: Context filters make downstream filters faster, but do not reduce quick filter processing cost; they can even increase extract size and slow down the dashboard.
* C. Only Relevant Values: This actually slows performance because Tableau must re-evaluate the entire data set to determine relevancy every time filters update.
Thus, A and D are the correct performance-improvement approaches.
* Tableau Performance Checklist recommending Apply button for multi-select filters.
* Performance documentation advising the use of Filter Actions over multiple quick filters.
* Filtering best practices explaining the cost of Only Relevant Values.
NEW QUESTION # 19
A client has several long-term shipping contracts with different vendors that set rates based on shipping volume and speed. The client requests a dashboard that allows them to model shipping costs for the next week based on the selected shipping vendor. Speed for the end user is critical.
Which dashboard building strategy will deliver the desired result?
- A. Use a calculated field that refers to a user-selected parameter to calculate shipping costs for each order and then display the aggregate values.
- B. Recommend that the client model for only profitability for the next 24 hours instead of a full week.
- C. Aggregate the orders then use a calculated field that refers to a user-selected parameter to calculate the shipping costs.
- D. Calculate the potential shipping cost for each order with each vendor, display the aggregate costs in a large table, and use quick filters to limit the options visible to the user.
Answer: A
Explanation:
For modeling shipping costs based on varying vendor contracts and ensuring speed in dashboard performance, the suggested approach involves:
Calculated Field with Parameter: Utilize a calculated field that dynamically references a user-selected parameter for the shipping vendor. This parameter adjusts the cost calculations based on selected vendor characteristics (like volume and speed).
Aggregate Results: After calculating individual shipping costs, aggregate these costs to provide a concise, summarized view of potential expenses for the upcoming week. This method ensures the dashboard remains performant by reducing the load of processing individual line items in real-time.
Why This Works: By using parameters and calculated fields, the dashboard can quickly adapt to user inputs without needing to re-query the entire dataset. Aggregating the results further improves performance and user experience by simplifying the output.
References
This strategy leverages Tableau's capability to handle dynamic calculations with parameters and is recommended for scenarios where performance and user-driven interaction are priorities. Tableau's performance optimization resources and dashboard design guidelines detail these techniques.
NEW QUESTION # 20
An online sales company has a table data source that contains Order Date. Products ship on the first day of each month for all orders from the previous month.
The consultant needs to know the average number of days that a customer must wait before a product is shipped.
Which calculation should the consultant use?
- A. Calc1: DATETRUNC ('month', DATEADD('month', 1, [Order Date]))
Calc2: AVG(DATEDIFF ('week', [Order Date], [Calc1])) - B. Calc1: DATETRUNC ('day', DATEADD ('day', 31, [Order Date]))
Calc2: AVG ([Order Date] - [Calc1]) - C. Calc1: DATETRUNC ('day', DATEADD('week', 4, [Order Date]))
Calc2: AVG([Order Date] - [Calc1]) - D. Calc1: DATETRUNC ('month', DATEADD ('month', 1, [Order Date]))
Calc2: AVG(DATEDIFF ('day', [Order Date], [Calc1]))
Answer: D
Explanation:
The correct calculation to determine the average number of days a customer must wait before a product is shipped is to first find the shipping date, which is the first day of the following month after the order date. This is done using DATETRUNC('month', DATEADD('month', 1, [Order Date])). Then, the average difference in days between the order date and the shipping date is calculated using AVG(DATEDIFF('day', [Order Date], [Calc1])). This approach ensures that the average wait time is calculated in days, which is the most precise measure for this scenario.
References: The solution is based on Tableau's date functions and their use in calculating differences between dates, which are well-documented in Tableau's official learning resources and consultant documents12.
To calculate the average waiting days from order placement to shipping, where shipping occurs on the first day of the following month:
Calculate Shipping Date (Calc1): Use the DATEADD function to add one month to the order date, then apply DATETRUNC to truncate this date to the first day of that month. This represents the shipping date for each order.
Calculate Average Wait Time (Calc2): Use DATEDIFF to calculate the difference in days between the original order date and the calculated shipping date (Calc1). Then, use AVG to average these differences across all orders, giving the average number of days customers wait before their products are shipped.
References:
Date Functions in Tableau: Functions like DATEADD, DATETRUNC, and DATEDIFF are used to manipulate and calculate differences between dates, crucial for creating metrics that depend on time intervals, such as customer wait times in this scenario.
NEW QUESTION # 21
From the desktop, open the CC workbook.
Open the Manufacturers worksheet.
The Manufacturers worksheet is used to
analyze the quantity of items contributed by
each manufacturer.
You need to modify the Percent
Contribution calculated field to use a Level
of Detail (LOD) expression that calculates
the percentage contribution of each
manufacturer to the total quantity.
Enter the percentage for Newell to the
nearest hundredth of a percent into the
Newell % Contribution parameter.
From the File menu in Tableau Desktop, click
Save.
Answer:
Explanation:
See the complete Steps below in Explanation:
Explanation:
To modify the Percent Contribution calculated field to use a Level of Detail (LOD) expression and accurately calculate the percentage contribution of each manufacturer to the total quantity, follow these steps:
* Open the CC Workbook and Access the Worksheet:
* Double-click on the CC workbook from the desktop to open it in Tableau Desktop.
* Navigate to the Manufacturers worksheet by selecting its tab at the bottom of the window.
* Modify the Percent Contribution Calculated Field:
* Navigate to the Data pane and find the "Percent Contribution" calculated field.
* Right-click on the "Percent Contribution" field and select 'Edit'.
* Modify the formula to incorporate an LOD expression that calculates the total quantity across all manufacturers and the specific quantity per manufacturer:
{FIXED [Manufacturer]: SUM([Quantity])} / {SUM([Quantity])}Quantity])}
* This formula uses {FIXED [Manufacturer]: SUM([Quantity])} to compute the total quantity contributed by each manufacturer, regardless of other dimensions in the view. The total quantity
{SUM([Quantity])} calculates the grand total across all manufacturers. The division calculates the percentage contribution.
* Click 'OK' to save the updated calculated field.
* Enter Percentage for Newell:
* With the updated "Percent Contribution" field, drag it onto the view to update the chart or table.
* Identify the value corresponding to 'Newell' in the updated visualization.
* Round this value to the nearest hundredth of a percent as required.
* Enter this value into the "Newell % Contribution" parameter. To do this, locate the parameter in the Data pane or on the dashboard, right-click it, and choose 'Edit'. Enter the calculated percentage for Newell.
* Save Your Changes:
* From the File menu, click 'Save' to store all the modifications you have made to the workbook.
References:
Tableau Help: Offers detailed guidance on using LOD expressions for precise and context-independent aggregations.
Tableau Desktop User Guide: Provides comprehensive instructions on managing calculated fields and parameters, ensuring accurate data analysis.
By following these steps, you will have successfully updated the calculation for percent contribution using LOD expressions, providing a more accurate analysis of each manufacturer's contribution to the total quantity.
Moreover, updating the parameter with Newell's specific contribution rounds out the task by reflecting precise data inputs for reporting or further analysis.
NEW QUESTION # 22
A consultant wants to improve the performance of reports by moving calculations to the data layer and materializing them in the extract.
Which calculation should the consultant use?
- A. ZN([Sales])*(1 - ZN([Discount]))
- B. CASE [Sector Parameter]
WHEN 1 THEN "green"
WHEN 2 THEN "yellow" - C. POWER(ZN(SUM([Sales]))/
LOOKUP(ZN(SUM([Sales])), FIRST()),ZN(1/(INDEX()-1)))- 1END - D. SUM([Profit])/SUM([Sales])
Answer: D
Explanation:
To improve performance by moving calculations to the data layer and materializing them in the extract, the consultant should choose calculations that benefit from pre-computation and significantly reduce the load during query time:
* Aggregation-Level Calculation: The formula SUM([Profit])/SUM([Sales]) calculates a ratio at an aggregate level, which is ideal for pre-computation. Materializing this calculation in the extract means that the complex division operation is done once and stored, rather than being recalculated every time the report is accessed.
* Performance Improvement: By pre-computing this aggregate ratio, Tableau can utilize the pre- calculated fields directly in visualizations, which speeds up report loading and interaction times as the heavy lifting of data processing is done during the data preparation stage.
References:
Materialization in Extracts: This concept involves pre-calculating and storing complex aggregations or calculations within the Tableau data extract itself, improving performance by reducing the computational load during visualization rendering.
NEW QUESTION # 23
A client has a published data source in Tableau Server and they want to revert to the previous version of the data source. The solution must minimize the impact on users.
What should the consultant do to accomplish this task?
- A. Delete and recreate the data source manually.
- B. Select a previous version from Tableau Server, download it, and republish that data source.
- C. Request that a server administrator restore a Tableau Server backup.
- D. Select a previous version from Tableau Server, and then click Restore.
Answer: D
Explanation:
To minimize the impact on users when reverting to a previous version of a published data source in Tableau Server, the consultant should use the built-in revision history feature. By selecting a previous version from the revision history and clicking 'Restore', the data source will revert to that version without the need for a full server backup restoration or manual recreation of the data source. This process is quick and has the least amount of disruption to users.
References: The functionality and process for reverting to a previous version of a data source are outlined in Tableau's official documentation on working with content revisions1. This feature is part of Tableau Server's capabilities to manage and maintain data sources effectively21.
NEW QUESTION # 24
A shipping clerk wants to use a Sankey diagram to analyze the flow of goods between different categories, shipping modes, and locations to spot bottlenecks and optimize the most critical paths. The company uses Tableau Cloud.
How should the shipping clerk create a chart that depicts the above information?
- A. Use Show Me to start a view based on the fields selected.
- B. Search and download a suitable sandboxed Viz Extension from Tableau Exchange.
- C. Search and download a suitable sandboxed Accelerator from Tableau Exchange.
- D. Search and download a suitable Connector from Tableau Exchange.
Answer: B
Explanation:
Comprehensive and Detailed Explanation From Exact Extract:
Tableau Cloud does not natively contain a Sankey diagram in Show Me. Such advanced charts often require:
* A custom extension
* Or specialized templates built into Tableau Exchange
A sandboxed Viz Extension allows users to embed specialized visualization components (like Sankey diagrams) securely in Tableau Cloud. These extensions are designed for advanced chart types that are not available natively.
Accelerators provide prebuilt dashboards but are not intended for custom visual types such as Sankey.
Connectors relate to connecting to data sources, not visualization.
Show Me does not include a Sankey option.
Therefore, downloading a sandboxed Viz Extension is the correct approach.
* Viz Extensions documentation explaining support for custom charts, including Sankey.
* Tableau Exchange listing providing sandboxed visualization extensions for non-native chart types.
* Show Me panel documentation showing Sankey is not an included chart type.
NEW QUESTION # 25
A customer wants to leverage generative AI capabilities. The customer is currently on Tableau Server 2023.1.
How is the customer able to leverage generative AI in Tableau?
- A. Migrate Tableau Server to Tableau Cloud.
- B. Perform API calls from Tableau Server to sandboxed extensions hosted by Tableau.
- C. Upgrade Tableau Server from 2023.1 to the latest version.
- D. Use a dashboard accelerator from Tableau Exchange.
Answer: A
Explanation:
Comprehensive and Detailed Explanation From Exact Extract:
Tableau's official generative AI capability-Tableau Pulse and Einstein-powered Tableau AI features- are available only on Tableau Cloud, not Tableau Server.
Key Tableau facts:
* Tableau Server (any version, including new ones) does not provide generative AI capabilities.
* Tableau Cloud includes AI features such as:
* Tableau Pulse
* Einstein Copilot
* Natural language questions
* Automated insights
* Upgrading Tableau Server does not provide generative AI.
* Extensions and accelerators do not enable AI functionality.
Therefore, the customer must migrate from Tableau Server to Tableau Cloud to leverage generative AI.
* Tableau AI/Pulse documentation stating availability only in Tableau Cloud.
* Feature comparison charts showing generative AI unavailable on Tableau Server.
NEW QUESTION # 26
A client is evaluating which user roles to assign to managers. The managers need to view dashboards, create Data-Driven Alerts, and perform ad hoc analysis of existing Tableau data sources. A consultant must provide a solution that minimizes licensing costs.
Which role should the consultant recommend be assigned to the managers?
- A. Explorer
- B. Viewer
- C. Creator
- D. Site Administrator
Answer: A
Explanation:
Comprehensive and Detailed Explanation From Exact Extract:
Tableau documentation clearly defines user capabilities per license:
Viewer
* Can view dashboards only.
* Cannot create Data-Driven Alerts.
* Cannot perform ad hoc analysis.# Insufficient.
Explorer
* Can view dashboards.
* Can create Data-Driven Alerts.
* Can perform ad hoc analysis using existing published data sources.
* Does NOT require full creator-level capabilities.# Meets all requirements at lower cost than Creator.
Creator
* Full authoring, data source creation, and prep capabilities.
* Higher cost.# Overkill and violates "minimizes licensing costs."
Site Administrator
* Includes Creator capabilities plus admin privileges.
* Most expensive.# Not appropriate for managers.
Therefore, the correct and most cost-efficient role is Explorer.
* Tableau role capability matrix showing Explorers can create alerts and analyze existing data sources.
* Licensing guidance recommending Explorer for ad hoc analysis without data-source creation.
NEW QUESTION # 27
A client's dashboard has two sections dedicated to their shops and warehouses shown when a viewer chooses either shops or warehouses with a parameter.
There are a few quick filters that apply to both, while others apply to only shops or only warehouses.
Currently, the quick filters are all shown at the left side of the dashboard. The client wants to hide all filters, but when shown, make it easy for the viewer to find the quick filters that work for only shops or only warehouses.
Which solution should the consultant recommend that meets the client's needs and is most user-friendly?
- A. Use Dynamic Zone Visibility to show only the quick filters that apply with the chosen parameter value and a Show/Hide Button to hide container with all the filters.
- B. Divide the quick filters into three groups: General, for shops. Place the general filters on the left of dashboard for warehouses. Place other filters next to the sections to which they apply.
- C. Use Dynamic Zone Visibility to inform viewers which quick filters apply to warehouses or shops.
- D. Hide container with all quick filters with a Show/Hide Button.
Answer: A
Explanation:
The most user-friendly solution is to use Dynamic Zone Visibility in combination with a Show/Hide Button. This approach allows the dashboard to dynamically display only the relevant quick filters based on the viewer's selection of shops or warehouses, thus reducing clutter and focusing the user's attention on applicable filters. The Show/Hide Button further enhances the user experience by allowing viewers to toggle the visibility of the filter container, providing a clean and organized dashboard interface1.
References: Dynamic Zone Visibility is a feature in Tableau that enables dashboard elements to appear or disappear based on the value of a field or parameter1. This functionality is ideal for creating interactive and user-friendly dashboards that adapt to user interactions and selections1.
NEW QUESTION # 28
A client currently has a workbook with the table shown below.
Which method will produce the output for the Total Sales Value field for all the categories shown in the table?
- A. Level of Detail (LOD) Calculation
- B. MAX() Function
- C. Quick Table Calculation
- D. A Window Function
Answer: A
Explanation:
To calculate the Total Sales Value for all categories as displayed in the table, an LOD expression is ideal. An LOD calculation in Tableau allows you to compute values at the data level that is different from the view level. In this case, since the Total Sales Value appears consistent across different sub-categories within each category, an LOD expression can be used to fix the Total Sales Value irrespective of the sub-category detail.
Here's how to set it up:
* Go to the Calculations area by right-clicking in the data pane and selecting "Create Calculated Field".
* Enter a name for the calculation, such as "Total Sales Value".
* Enter the LOD expression: { FIXED [Category] : SUM([Sales]) }. This calculation fixes the total sales to the category level, effectively summing sales for all sub-categories within each category, irrespective of how the data is broken down in the view.
* Drag this new calculated field into your visualization alongside the existing measures.
This method ensures that the Total Sales Value reflects the total for each category across all its sub-categories, matching the uniform values shown across different rows for each category in your table.
References
The explanation utilizes the concept of Level of Detail calculations in Tableau, which allows for advanced aggregations independent of the view level details. This concept is covered extensively in Tableau's official documentation and relevant training materials such as Tableau's online help resources.
NEW QUESTION # 29
A client has a dashboard that renders in less than 10 seconds. The client receives a request to add a new calculated field that will return TRUE if a Project contains any one of the values "Project 1" or "Project 2" and FALSE otherwise. After adding the function found below, the dashboard's render time increases to 14 seconds from 10 seconds.
[Project] = 'Project 1' OR [Project] = 'Project 2'
Which function should the consultant use to reduce the render time?
- A. [Project] IN ('Project 1' OR 'Project 2')
- B. [Project] = 'Project 1' AND [Project] = 'Project 2'
- C. (([Project] = 'Project 1') OR ([Project] = 'Project 2'))
- D. [Project] IN ('Project 1', 'Project 2')
Answer: D
Explanation:
Comprehensive and Detailed Explanation From Exact Extract:
Tableau documentation states that IN expressions are optimized internally for better query performance than multiple OR statements. They are pushed efficiently to the data source and simplified during query compilation.
The original expression uses two OR conditions, which increases the complexity of row-level evaluation:
[Project] = 'Project 1' OR [Project] = 'Project 2'
Tableau's performance guidelines recommend replacing multiple OR comparisons with an IN expression whenever possible:
[Project] IN ('Project 1', 'Project 2')
This reduces rendering time by minimizing row evaluation overhead and creating a cleaner, optimized logical condition.
Option D achieves this exactly.
Option A is logically incorrect because a project cannot simultaneously equal both values.
Option B is syntactically incorrect because IN expects a list, not an OR inside the list.
Option C is simply a reformatting of the original OR expression and provides no performance improvement.
Option D is the only valid, optimized solution.
* Tableau calculation optimization guidance recommending IN over OR for performance.
* Tableau's query performance notes indicating that OR statements expand logical branches and slow down evaluation.
* Best practices for row-level calculations suggesting simplified logical expressions.
NEW QUESTION # 30
SIMULATION
Refer to the exhibit.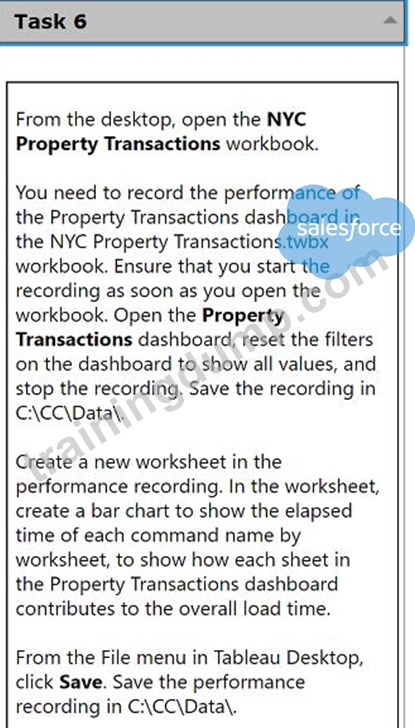
From the desktop, open the NYC
Property Transactions workbook.
You need to record the performance of
the Property Transactions dashboard in
the NYC Property Transactions.twbx
workbook. Ensure that you start the
recording as soon as you open the
workbook. Open the Property
Transactions dashboard, reset the filters
on the dashboard to show all values, and
stop the recording. Save the recording in
C:\CC\Data\.
Create a new worksheet in the
performance recording. In the worksheet,
create a bar chart to show the elapsed
time of each command name by
worksheet, to show how each sheet in
the Property Transactions dashboard
contributes to the overall load time.
From the File menu in Tableau Desktop,
click Save. Save the performance
recording in C:\CC\Data\.
Answer:
Explanation:
See the complete Steps below in Explanation
Explanation:
To record the performance of the Property Transactions dashboard in the NYC Property Transactions.twbx workbook and analyze it using a bar chart, follow these detailed steps:
Open the NYC Property Transactions Workbook:
From the desktop, double-click the NYC Property Transactions.twbx workbook to open it in Tableau Desktop.
Start Performance Recording:
Before doing anything else, navigate to the 'Help' menu in Tableau Desktop.
Select 'Settings and Performance', then choose 'Start Performance Recording'.
Open the Property Transactions Dashboard and Reset Filters:
Navigate to the Property Transactions dashboard within the workbook.
Reset all filters to show all values. This usually involves selecting the dropdown on each filter and choosing 'All' or using a 'Reset' button if available.
Stop the Performance Recording:
Go back to the 'Help' menu.
Choose 'Settings and Performance', then select 'Stop Performance Recording'.
Tableau will automatically open a new tab displaying the performance recording results.
Save the Performance Recording:
In the performance recording results tab, go to the 'File' menu.
Click 'Save As' and navigate to the C:\CC\Data\ directory.
Save the file, ensuring it is stored in the desired location.
Create a New Worksheet for Performance Analysis:
Return to the NYC Property Transactions workbook and create a new worksheet by clicking on the 'New Worksheet' icon.
Drag the 'Command Name' field to the Columns shelf.
Drag the 'Elapsed Time' field to the Rows shelf.
Ensure that the 'Worksheet' field is also included in the analysis to break down the time by individual sheets within the dashboard.
Choose 'Bar Chart' from the 'Show Me' options to display the data as a bar chart.
Customize and Finalize the Bar Chart:
Adjust the axes and labels to clearly display the information.
Format the chart to enhance readability, applying color coding or sorting as needed to emphasize sheets with longer load times.
Save Your Work:
Once the new worksheet and the performance recording are complete, ensure all work is saved.
Navigate to the 'File' menu and click 'Save', confirming that changes are stored in the workbook.
References:
Tableau Help Documentation: Provides guidance on how to start and stop performance recordings and analyze them.
Tableau Visualization Techniques: Offers tips on creating effective bar charts for performance data.
By following these steps, you have successfully recorded and analyzed the performance of the Property Transactions dashboard, providing valuable insights into how each component of the dashboard contributes to the overall load time. This analysis is crucial for optimizing dashboard performance and ensuring efficient data visualization.
NEW QUESTION # 31
......
Get Analytics-Con-301 Actual Free Exam Q&As to Prepare Certification: https://www.trainingdump.com/Salesforce/Analytics-Con-301-practice-exam-dumps.html
Analytics-Con-301 100% Guarantee Download Analytics-Con-301 Exam PDF Q&A: https://drive.google.com/open?id=1vMm56B6cqopRVu-mfqiSRFz8vbT2Oks1